Funnel Analysis: How to Find Where Users Drop Off
A hundred people start, three finish. A funnel shows you which step ate the other ninety-seven, so you fix the leak instead of guessing.
Every product has a path it wants people to walk. Install, sign up, reach the first real moment of value, come back, pay. Almost nobody walks the whole thing. A hundred people start, and by the end a handful are left. The question that decides whether your product grows is a simple one: where did the other ninety-something go?
Funnel analysis is how you answer that without guessing. Instead of a vague sense that “onboarding could be better,” you get a specific number on a specific step, and specific numbers are things you can fix.
What a funnel actually is
A funnel is an ordered list of steps, where each step counts how many people made it that far. That is the whole concept. You define the sequence you care about, then count how many unique users reach each stage in order.
Here is a typical onboarding funnel for an app:
| Step | Users | Reached | Step drop |
|---|---|---|---|
| Installed | 10,000 | 100% | |
| Opened the app | 7,200 | 72% | 28% |
| Completed signup | 3,900 | 39% | 46% |
| Reached first value | 1,500 | 15% | 62% |
| Made a purchase | 420 | 4.2% | 72% |
Two columns matter, and they say different things. “Reached” is conversion from the very top, the honest measure of how many survive the whole journey. “Step drop” is the fall from the previous step, and that is where you find the leak.
Read that table for ten seconds and the story jumps out. The single worst step is signup to first value: 62% of people who signed up never reach the moment the product actually pays off. That one row is worth more than the other four combined, because it is where the most people quit closest to caring.
How to read a funnel
The instinct is to panic at the biggest absolute number. Only 4.2% purchase, so fix purchasing. Usually wrong. The purchase step lost 72% of a group that was already tiny. Fixing it moves a small number.
The real target is the biggest step drop among steps that still have volume. In the table above, that is “reached first value.” Recover even a third of that drop and everything downstream inherits the gain, because a funnel multiplies. More people at value means more people at purchase, automatically, without touching the purchase step at all.
So the reading order is:
- Find the steps with the steepest step drop.
- Among those, favor the earliest one with real volume, because fixes there compound through every step after it.
- Ignore, for now, tiny drops and steps that only a handful reach.
A funnel does not tell you why people left. It tells you exactly where, which is the hard part. The where turns “our conversion is bad” into “62% of signups never finish setup,” and that is a problem a team can actually walk over and look at.
The mistakes that make a funnel lie
Funnels are easy to draw and easy to draw wrong. The common ways they mislead:
- Not deduping by user. If a step counts events instead of people, one user who retried signup three times shows as three. Count unique users per step, not raw event rows.
- Loose step order. A funnel assumes sequence. If you count anyone who ever hit step 3, including people who did it before step 2, the math stops meaning anything. Steps should be reached in order.
- Blended cohorts. Mixing people who started last year with people who started today hides trends. A funnel is most honest over a defined window, a cohort that entered in the same period.
- Too many steps. A twelve-step funnel is noise. Pick the four or five moments that actually matter. You can always zoom into one leaky step with its own funnel afterward.
- Only looking at the average. One funnel for everyone hides that the leak might be one platform, one version, or one country. More on that below.
Building a funnel from your events
A funnel is not a special data type. It is a query over the same events you already track. If you have not set up event tracking yet, that comes first, and the event tracking guide covers how to name and structure events so a funnel is even possible. Assuming you have events with a name, an identity, and a timestamp, a funnel is a matter of counting distinct identities that reached each named step.
Conceptually, one step of the funnel is just this:
SELECT count(DISTINCT identity) AS users
FROM events
WHERE name = 'signup_completed'
  AND event_time BETWEEN {start} AND {end};
Run that per step, keep the ordering constraint that each identity reached the earlier steps first, and you have the whole table. Tools differ in how much of this they hide behind a UI, but underneath, every funnel is count-distinct-users-per-step over your event stream. When you can query the events directly, a funnel is something you define, not something you wait for a vendor to add. We made the broader case for that in why your analytics should run on SQL.
Segment the funnel, or miss the real story
The single most useful move in funnel analysis is refusing to trust the average.
An overall funnel says 46% drop at signup. Split it and the truth appears: signup converts fine on desktop and falls off a cliff on mobile, or it is healthy on version 1.3 and broke in 1.4, or one country tanks the blended number. The average was hiding a specific, fixable problem inside a vague one.
So build the funnel once, then slice it:
- By platform. iOS vs Android vs web often drop at completely different steps.
- By version. A funnel that got worse right after a release points straight at what the release changed.
- By country or source. Low-intent traffic drops early. That is an acquisition problem wearing a funnel’s clothes, and worth separating from a genuine product leak.
This is exactly where dashboard filters earn their keep. Rather than building a separate funnel per segment, build one and toggle the slice, which we covered in using filter presets instead of ten dashboards. The leak you are hunting is often invisible until you filter to the segment where it lives.
The bottom line
A funnel turns “people are not converting” into “62% of signups never reach first value on mobile in version 1.4.” The first sentence is an anxiety. The second is a task. That translation, from a fog of lost users into a named step you can go fix, is the entire point of funnel analysis.
Track the events, order them into the steps that matter, count unique users at each, and then, crucially, segment. The biggest early drop with real volume is almost always your highest-leverage fix, because a funnel multiplies every improvement downstream.
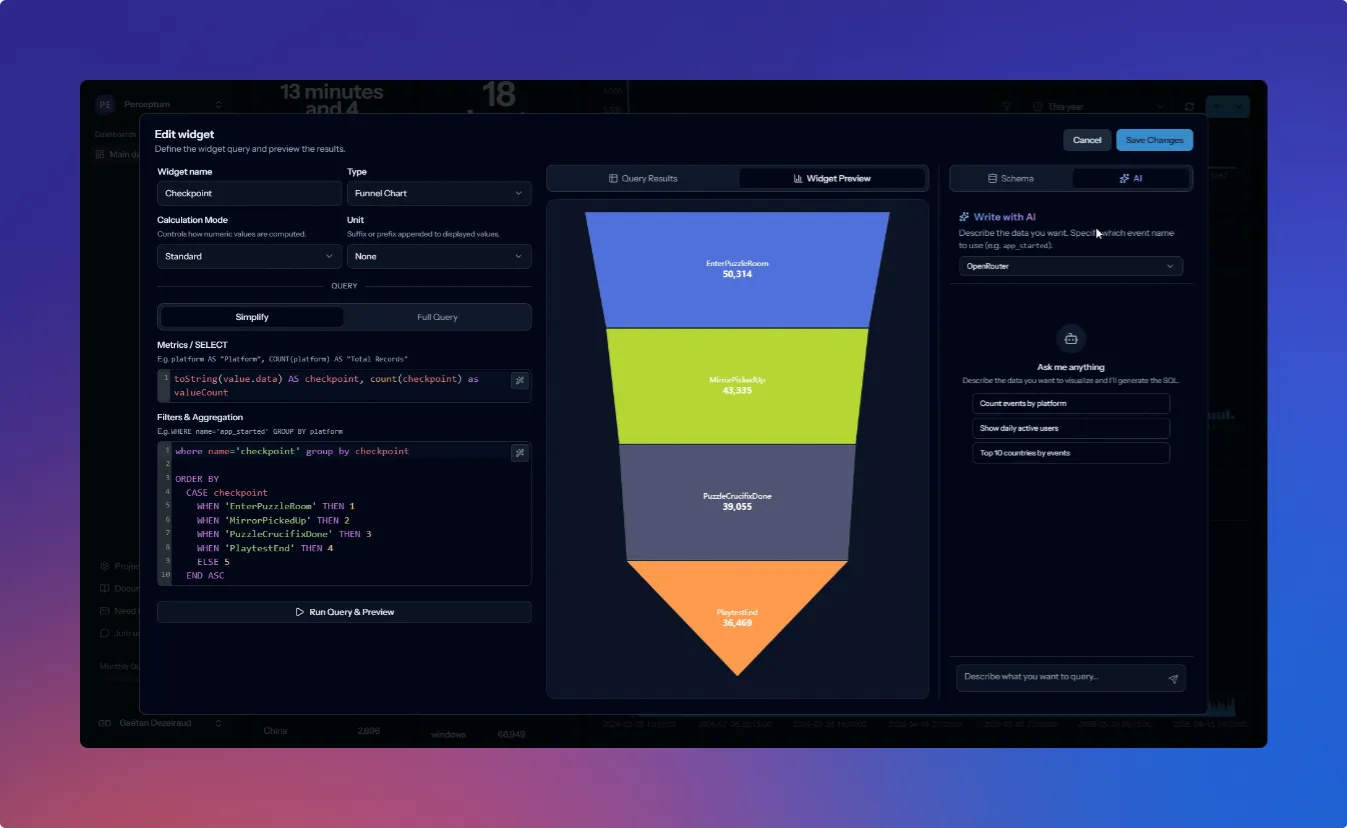
Hintway is built to make this direct. Your events carry identity, session, platform, and version, so a funnel is a query you shape by hand or with AI, visualized as a chart and sliced by any dimension with a filter. Find the leak, fix the step, watch the whole funnel lift. The getting started guide takes you from first event to first dashboard.
Ready to see analytics that actually answers your questions?
Get Started Free